CMS releases prescriber-level Medicare data for first time
The Centers for Medicare & Medicaid Services (CMS) released a new dataset that details information on the prescription drugs that individual physicians and other health care providers prescribed in 2013 under the Medicare Part D Prescription Drug Program. Approximately 68 percent of all Medicare beneficiaries are enrolled in the Part D program, 36 million people. The dataset describes the specific medications prescribed and statistics on their utilization and costs. It provides data on more than one million distinct health care providers who collectively prescribed $103 billion in prescription drugs under the Part D program. The new data is posted on the CMS website at www.cms.gov/Research-Statistics-Data-and-Systems/Statistics-Trends-and-Reports/Medicare-Provider-Charge-Data/Part-D-Prescriber.html. Â
CMS created the new dataset using information from the Prescription Drug Event Standard Analytic File (SAF), which has final-action claims submitted by Medicare Advantage Prescription Drug (MA-PD) plans and by stand-alone Prescription Drug Plans (PDPs). The new dataset identifies providers using their National Provider Identifier (NPI) and the specific prescriptions dispensed on their behalf, listed by brand name (if applicable) and generic name as enumerated by First Databank. Â
For each prescriber and drug, the dataset includes the total number of prescriptions that were dispensed (including original prescriptions and any refills), and the total drug cost. The total drug cost includes the ingredient cost of the medication, dispensing fees, sales tax, and any applicable administration fees. Itâs based on the amounts paid by the Part D plan, Medicare beneficiary, other government subsidies, and any other third-party payers (such as employers and liability insurers). Total drug costs do not reflect any manufacturer rebates paid to Part D plan sponsors. Â In order to protect beneficiary privacy, CMS did not include information in cases where 10 or fewer prescriptions were dispensed.
This new dataset provides key information to consumers, providers, researchers, and other stakeholders to help drive transformation of the health care delivery system. This data enables a wide range of analyses on the type of prescription drugs prescribed in the Medicare Part D program, and on prescription drug utilization and spending generally. Â
The new dataset can be used to examine the relative rank of drugs by utilization.  Below are the top 10 drugs in 2013 by claim count  (Table 1a). All of the top 10 drugs are generic drugs.  The claim counts for these drugs ranged from 21.0 to 36.9 million claims and the total drugs costs for each drug ranged from $145 million to $911 million.
Table 1a. Top Ten Drugs by Claim Count, 2013
| Drug Name | Total Claim Count | Beneficiary Count | Prescriber Count | Total Drug Cost |
| Lisinopril | 36,880,274 | 7,006,650 | 457,683 | $307,033,173 |
| Simvastatin | 36,746,410 | 7,030,295 | 399,127 | $433,687,284 |
| Levothyroxine Sodium | 35,175,372 | 5,738,528 | 407,726 | $396,128,533 |
| Hydrocodone-Acetaminophen | 34,756,062 | 8,086,006 | 691,028 | $567,735,880 |
| Amlodipine Besylate | 34,598,901 | 6,244,693 | 441,869 | $343,338,072 |
| Omeprazole | 32,250,368 | 6,381,404 | 468,856 | $643,037,584 |
| Atorvastatin Calcium | 26,672,349 | 5,345,756 | 390,105 | $910,768,027 |
| Furosemide | 26,441,045 | 5,002,942 | 446,350 | $144,880,536 |
| Metformin Hcl | 22,041,166 | 4,134,345 | 357,620 | $226,623,581 |
| Metoprolol Tartrate | 21,035,020 | 3,900,221 | 405,902 | $162,047,499 |
Table 1b below shows the 2013 top 10 drugs by cost. These drugs are all brand name drugs with relatively fewer claims than the top drugs by claim seen in Table 1a above. Â While claim counts ranged from as few as 150,000 claims to as many as more than 9 million claims, total drug costs for each drug in Table 1b were all more than $1 billion.
Table 1b. Top Ten Drugs by Costs, 2013
| Drug Name | Total Drug Cost | Beneficiary Count | Prescriber Count | Total Claim Count |
| Nexium | $2,526,306,069 | 1,484,011 | 294,246 | 8,192,362 |
| Advair Diskus | $2,262,995,221 | 1,527,217 | 288,140 | 6,605,423 |
| Crestor | $2,216,193,162 | 1,732,787 | 262,938 | 9,066,409 |
| Abilify | $2,107,091,535 | 396,764 | 127,070 | 2,886,837 |
| Cymbalta | $1,961,132,000 | 1,032,774 | 266,510 | 6,887,543 |
| Spiriva | $1,958,581,193 | 1,181,599 | 247,099 | 5,735,127 |
| Namenda | $1,564,775,426 | 798,714 | 176,825 | 6,878,399 |
| Januvia | $1,460,522,984 | 761,776 | 186,130 | 4,358,783 |
| Lantus Solostar | $1,371,996,461 | 862,887 | 212,687 | 3,863,847 |
| Revlimid | $1,349,964,592 | 24,637 | 8,888 | 153,782 |
1Claims count represents prescription drug fills which can cover varying lengths of time.
The new dataset can also be used to examine how patterns of prescribing vary across specialties in the Medicare program. Â For example, many dentists prescribed in the Part D program in 2013, but on average for the year, they only prescribed two drugs (see Table 2 below). Accordingly, the average total drug cost attributed to dentists of $855 was relatively low. Â In comparison, family practitioners prescribed 75 drugs on average and their average total drug cost per provider was $211,977.
Table 2. Average Costs and Number of Unique Drug Products for Specialties with the Highest Number of Prescribers, 2013
| Specialty | Number of Prescribers | Average Total Costs | Cost per Claim | Average Number of Unique Drug Products Prescribed |
| Internal Medicine | 130,640 | $205,923 | $63 | 65.7 |
| Dentist | 124,322 | $855 | $14 | 2.1 |
| Family Practice | 105,413 | $211,977 | $56 | 74.9 |
| Nurse Practitioner | 97,722 | $67,708 | $78 | 24.2 |
| Physician Assistant | 69,180 | $47,405 | $70 | 18.7 |
| Emergency Medicine | 43,664 | $16,822 | $41 | 9.5 |
| Organized Health Care Education/Training Program - Student | 42,307 | $8,036 | $67 | 5.6 |
| Obstetrics/Gynecology | 35,979 | $15,953 | $85 | 6.2 |
| Psychiatry | 25,906 | $174,274 | $104 | 28.3 |
| Optometry | 25,654 | $17,501 | $99 | 4.8 |
Chart 1 below shows the 5 prescriber specialties with the highest total Part D drug costs in 2013 and the 2013 average cost per claim for these specialties. Combined, the 5 specialties below represented 63% of total drug costs in this dataset. In addition, internal medicine, family practice, and nurse practitioner comprise the top 5 highest prescribing specialties based on the number of Part D fills. This is largely because these represent 36% of all prescribers and they see a large volume of Medicare patients. Â In addition, as shown in the chart, these specialties have a lower cost per claim than other specialties such as neurology. Across all specialties, the average cost per claim was $75.
Chart 1. Prescriber Specialties with the Highest Total Drug Costs, 2013
Chart 2 below shows that a large number of internal medicine physicians prescribed under the Part D program in 2013 and thus these physicians had a large combined total cost to the program, but their average drug claim cost was low compared to some other specialties. In comparison, hematology and neurology specialists comprised much smaller groups of prescribers (shown by the smaller bubble sizes) and had lower total drug costs, but both had much higher average drug claim costs, reflecting the higher-cost treatments used by these specialties.
Chart 2. Average Cost per Claim versus Total Drug Costs for Selected Top Specialties, 2013
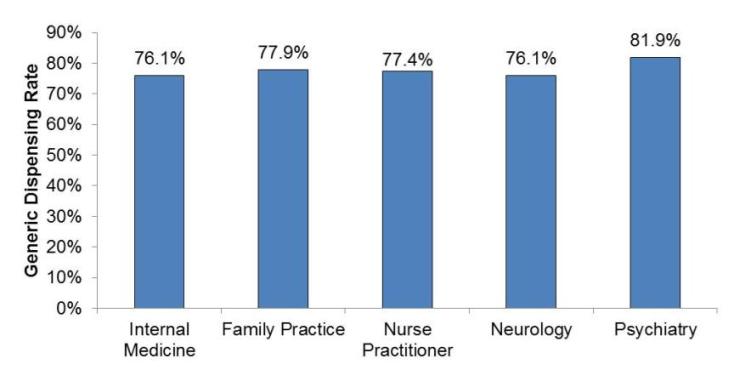
Chart 3 below shows the generic dispensing rates for the top 5 specialties with the highest total costs. Among the specialties shown below, the highest generic dispensing rate was seen from psychiatry specialists, with an average rate greater than 80%. Â
Chart 3. Generic Dispensing Rate by Specialty, 2013
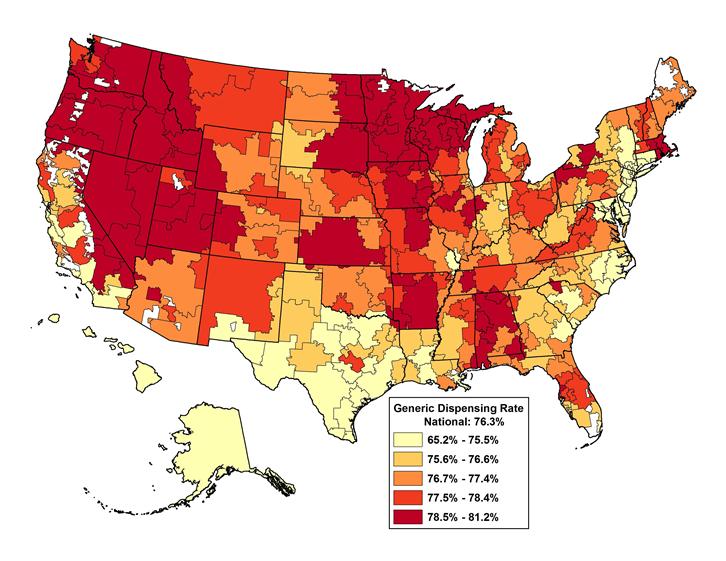
This data set also includes information to support geographic comparisons of prescribing. The map below (Chart 4) shows the percent of claims for generic drugs by Hospital Referral Region (HRR). Nationally, the generic dispensing rate for the Part D program in 2013 was 76.3%. Â The dispensing rate by HRR ranged from 70.3% to 80.0% with most regions in the upper end of the range. Â
Chart 4. Generic Dispensing Rate by Hospital Referral Region, 2013
Although the Part D Prescriber Public Use File (PUF) has a wealth of payment and utilization information about Medicare prescription drug events, the dataset also has a number of limitations that are worth noting. First, the data in the Part D Prescriber PUF may not be representative of a prescriberâs entire prescribing pattern. The data contains information only from Medicare beneficiaries with Part D coverage, but clinicians typically treat many other patients who do not have that form of coverage. Additionally, the data in this file are limited to medications covered by the Part D program and those drugs excluded by the Part D program but covered by individual Part D prescription drug plans through supplemental benefits. The data does not include over-the-counter medications or any prescriptions obtained outside the Part D benefit. Â Since not all Part D plans have supplemental coverage for excluded products, utilization and cost statistics presented in the data likely underestimates the true use of these products in this population. Â
The information presented in this file also does not indicate the quality of care provided by individual clinicians. The file only contains cost and utilization information, and the volume of prescriptions presented may not be fully inclusive of all prescriptions written by the provider.
The total drug costs included in these data reflect the prescription drug costs incurred by Medicare Part D beneficiaries, including costs that are paid by Medicare, by beneficiaries, and by third-party payors. The Part D prescription drug program is administered by private Part D plan insurers. Medicare pays Part D plans a monthly, risk-adjusted capitation payment for each enrollee. Â Beneficiaries also pay a monthly premium. In addition, Medicare pays Part D plans additional subsidies to cover reduced cost-sharing for low-income beneficiaries and a portion of the costs for beneficiariesâ whose drug costs are very high. Following each benefit year, CMS shares risk with plans by reconciling the capitation and various subsidy payments to actual drug cost expenditures determined from Prescription Drug Event records, and any manufacturer rebates or other direct and indirect remunerations received by the plan. Therefore, because the drug expenditures derived from the Prescription Drug Event data comprise only a piece of the payment process, it is not possible to directly attribute total drug costs at the prescriber or drug level to payments from the Medicare trust fund. Â Furthermore, these total drug costs do not reflect any manufacture rebates.
Visit www.cms.gov/Research-Statistics-Data-and-Systems/Statistics-Trends-and-Reports/Medicare-Provider-Charge-Data/Part-D-Prescriber.html to view the new prescriber dataset. Â Â
To read the press release, visit: http://cms.gov/Newsroom/MediaReleaseDatabase/Press-releases/2015-Press-releases-items/2015-04-30.html
###


